mukesh
fc4747668e
mukesh
fc4747668e
Three new subsections at the top of §5, motivated by the deployment-sizing
questions the analytical visualization tool exposes:

- 5.1 Roofline Analysis — B*, L*, short vs long context batch effect
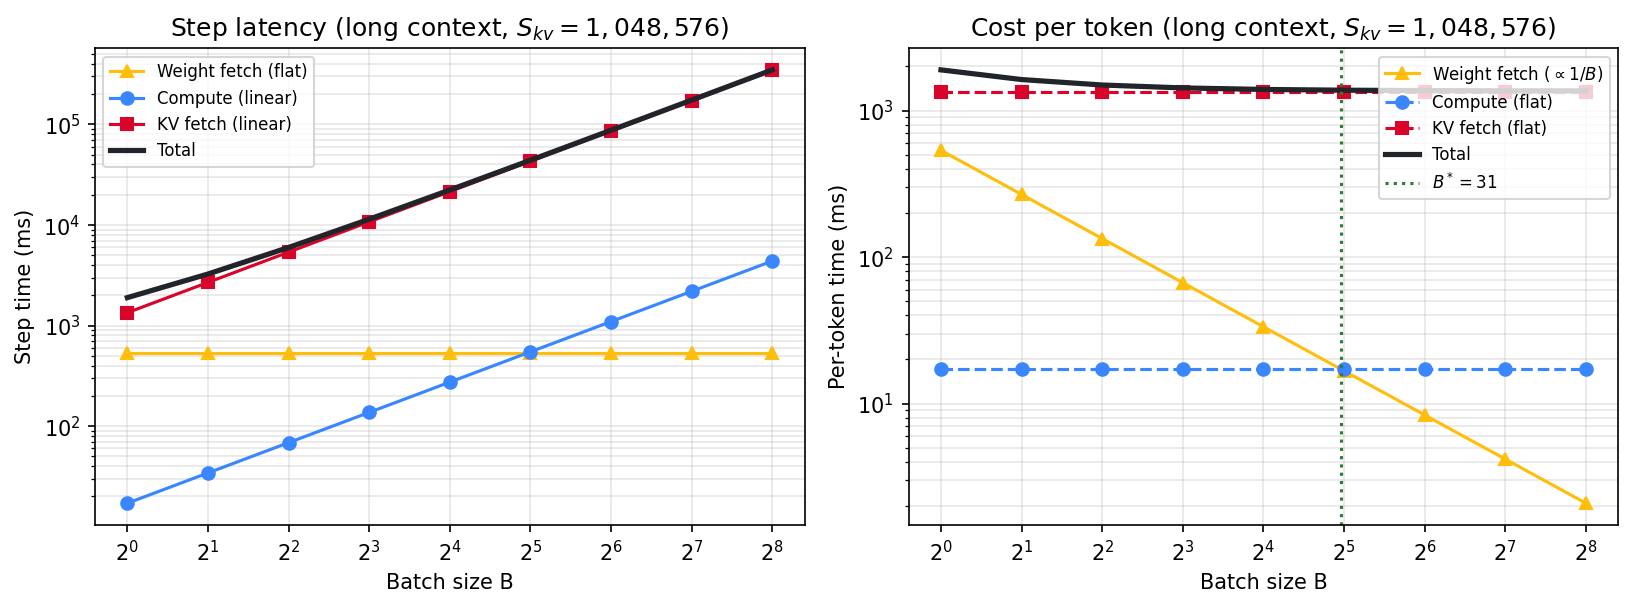
  (measured: 19× per-token cost reduction at short context, 28% at long)
- 5.2 Capacity Planning — 3-axis sizing (weights / KV / SLO), SLO targets,
  regime rules, deployment templates, per-axis playbook
- 5.3 Parallelism Selection — TP × CP × PP × DP × EP comparison,
  symptom-driven axis selection, add/stop criteria, misconceptions

Restructure:
- 05-gqa.tex trimmed to section header + intro
- Existing 5.4-5.7 content (placement, short/long ctx, composite) moved
  to 05x-fused-kernel.tex
- Summary extracted to 05z-summary.tex, cross-refs updated
- main.tex \input order sets the requested subsection sequence
- lmodern loaded to satisfy microtype font-expansion

Two new figures generated from tests/analytical_visualization/chip_roofline:
- roofline_short_context.png (S_kv=8K, batch wins)
- roofline_long_context.png (S_kv=1M, batch stalls at KV floor)
- Generator: tests/analytical_visualization/_gen_roofline_paper_figs.py

4 tables (regime rules, deployment templates, playbook, parallelism
criteria) use table* so they span both columns without overflow.

Co-Authored-By: Claude Opus 4.7 <noreply@anthropic.com>
98 KiB
1633x608px
98 KiB
1633x608px