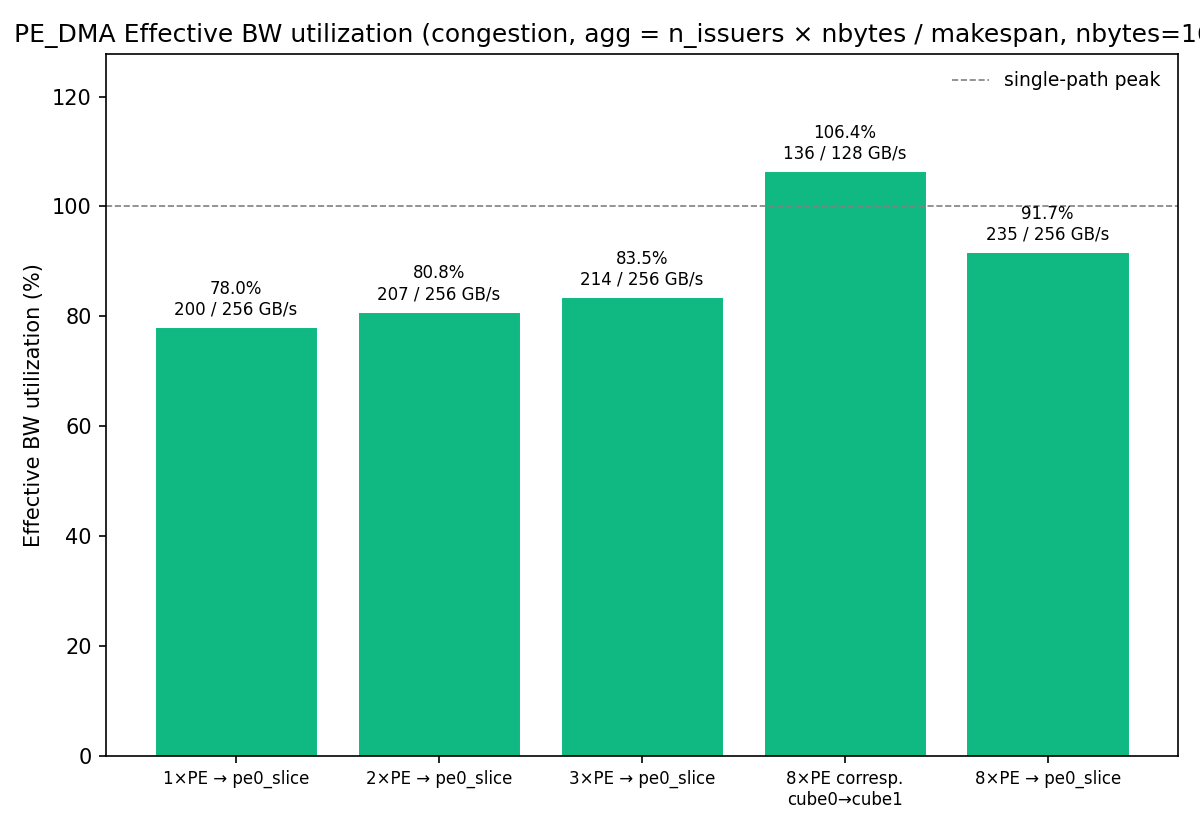
Replaces the latency-breakdown stacked bars with a single utilization
bar per scenario. Each bar shows ``effective_bw / peak_bottleneck_bw``
with both values annotated, and a horizontal "single-path peak" line at
100 %. The colour band (green ≥70 %, amber ≥40 %, red <40 %) makes the
no-congestion distance roll-off scannable at a glance.

Definitions:
  effective_bw = (total bytes transferred) / wall-clock time
    no_congestion: nbytes / total_ns
    congestion:    n_issuers × nbytes / makespan_ns  (aggregate)
  peak_bw      = min(edge.bw_gbs) on first issuer's path
  util_pct     = effective_bw / peak_bw × 100

The congestion graph shows that 8×PE eastbound exceeds 100 % of a
single-path peak (106.4 %): UCIe-N's 4 connections × 128 GB/s give
512 GB/s of aggregate eastbound capacity, so concurrent issuers across
disjoint conns sum past any single conn's 128 GB/s. The 8×PE→pe0_slice
hotspot reaches 91.7 %, almost saturating the shared r0c0→hbm_ctrl.pe0
bottleneck — the simulator's address-based PC striping + per-flit
arbitration model amortises the cost cleanly.

Self-verification updated to BW invariants:
  (1) effective BW shrinks as topological distance grows
  (2) util_pct ∈ (0, 250 %]
  (3) single-issuer util_pct ≤ 100 %
  (4) effective_bw = nbytes / total_ns for single requests
  (5) congestion aggregate BW grows monotonically with issuer count
      on the hot-target series
  (6) 8-PE all-hit-pe0 saturates ≥ 70 % of shared peak

All checks PASS at the current model.

The CSV retains all breakdown components (pe_setup, noc_mesh, ucie,
fabric, streaming, hbm_ctrl, contention) so a future replot can still
recover the latency-breakdown view without re-running the simulator.

Co-Authored-By: Claude Opus 4.7 (1M context) <noreply@anthropic.com>
58 KiB
1200x825px
58 KiB
1200x825px