ywkang
b64c43b947
ywkang
b64c43b947
The matplotlib title and gray subtitle were duplicating what the
figure caption already says in the LaTeX source, and crowding the
top of every chart. Drop both — chart now leaves the title/subtitle
slots blank and the caption is the single source of truth for
chart titling.

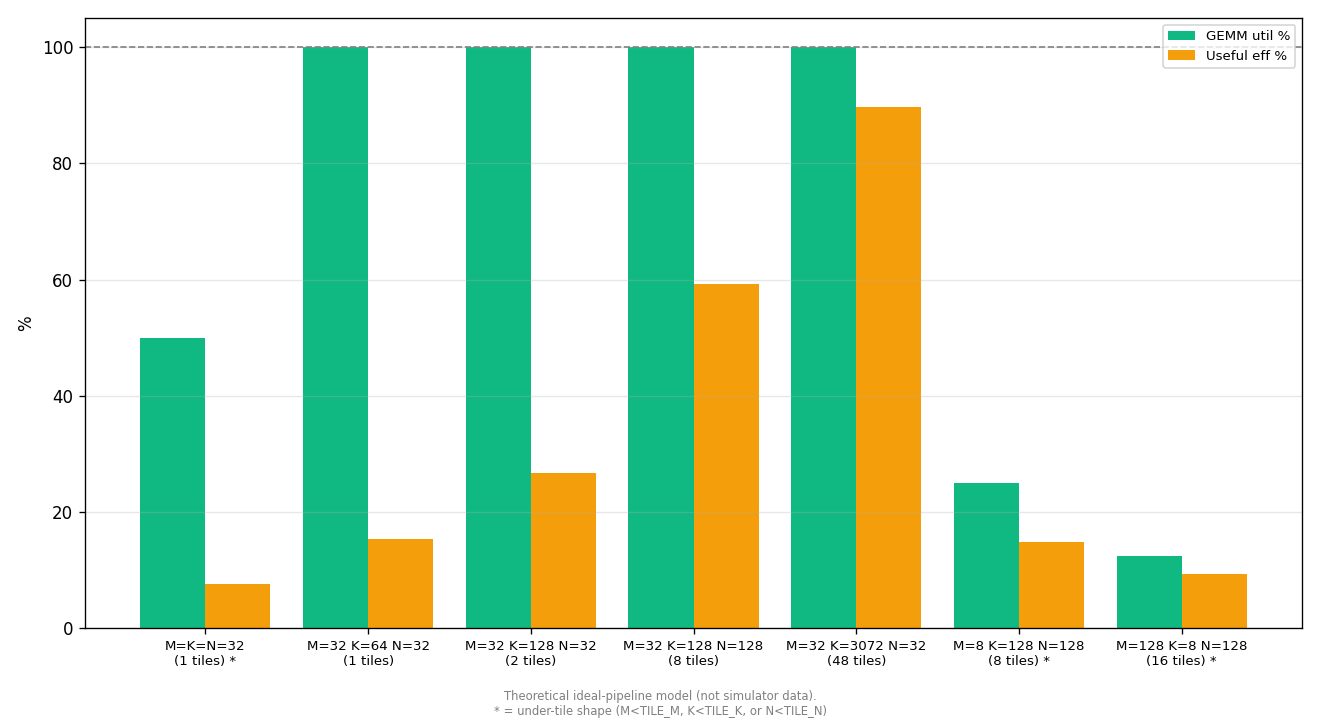
Re-render all 5 GEMM figures (mac util measured, mac util theoretical
vs measured, stage breakdown, HBM BW util, per-PE TFLOPS) and resync
into docs/report/1H-codesign-paper/figures/. No data changes.

Co-Authored-By: Claude Opus 4.7 (1M context) <noreply@anthropic.com>
29 KiB
1320x720px
29 KiB
1320x720px